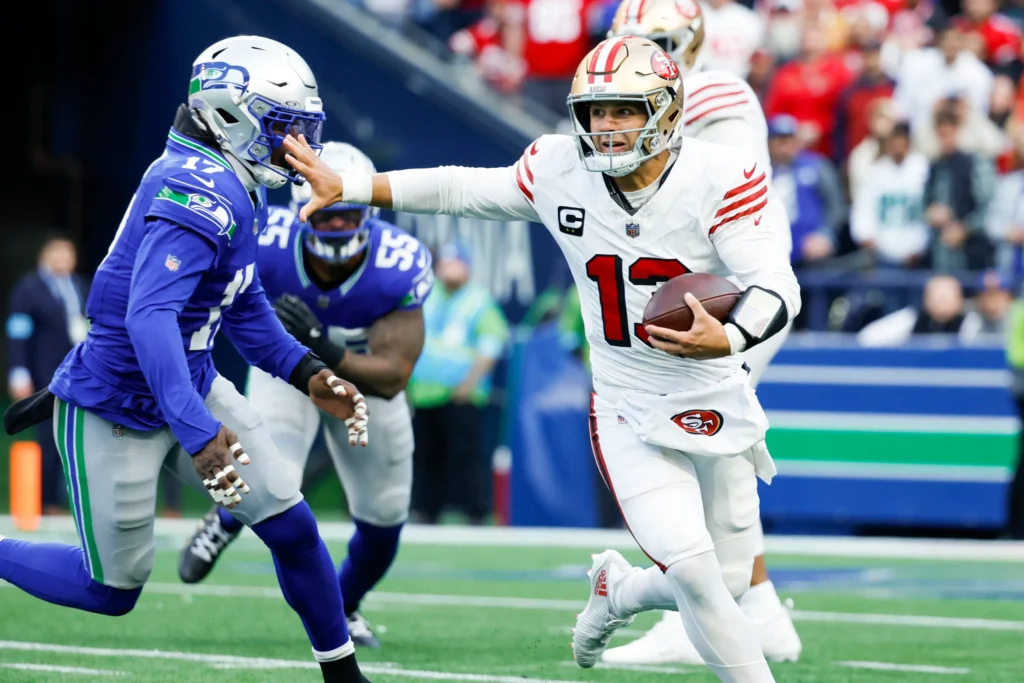
The 49ers vs Seahawks match player stats tell a much bigger story than the final score alone. When San Francisco traveled to Seattle for the NFC Divisional Round on January 17, 2026, the Seahawks produced a 41–6 victory that was driven by explosive special teams, an efficient passing game, a dominant rushing performance, and a defense that repeatedly created extra possessions.
The matchup was especially interesting because these teams had already met twice during the 2025 regular season. San Francisco won the opening meeting 17–13 in Seattle, while Seattle answered with a 13–3 victory at Levi’s Stadium in Week 18. The playoff meeting therefore became the third contest between the NFC West rivals in the same season.
For anyone researching 49ers vs Seahawks match player stats, this game provides plenty to examine. Quarterback numbers, rushing production, receiving totals, turnovers, field position, and individual scoring plays all contributed to the outcome. Below is a detailed look at what the numbers reveal and why the statistical story matters.
The Overall Story Behind the 41–6 Result
Seattle’s 41–6 win was not simply a case of scoring more points. The Seahawks were more efficient in several important areas, while San Francisco struggled to turn possessions into sustained offense. Seattle finished with 281 total yards compared with San Francisco’s 236, despite running eight fewer offensive plays. That difference resulted in 5.4 yards per play for Seattle versus 3.9 for the 49ers.
Turnovers were another major factor. San Francisco committed three turnovers, while Seattle committed none. The 49ers also lost two fumbles. In a postseason game, giving an opponent additional possessions can quickly change the shape of the contest, particularly when the opposing team is already converting drives efficiently.
The final score also reflected Seattle’s ability to capitalize early. The Seahawks scored 17 points in the opening quarter, added another seven in the second, and entered halftime with a commanding advantage. San Francisco managed only six points in the entire game, all of them coming from second-quarter field goals.
Brock Purdy’s Passing Performance
Brock Purdy entered the game as one of San Francisco’s most important offensive players, but the Seahawks defense made it difficult for him to establish a rhythm. Purdy completed 15 of 27 passes for 140 yards, with no touchdown passes and one interception. He was also sacked twice for a combined 16 yards.
Those numbers translate to a relatively modest passing day by Purdy’s standards. His longest completion was 19 yards, showing that San Francisco had difficulty producing consistent explosive passing plays. Seattle’s pressure and coverage combined to keep many of the 49ers’ throws underneath or relatively short.
Purdy did provide some production as a runner. He carried the ball five times for 37 yards, averaging 7.4 yards per attempt, with a long run of 18 yards. Interestingly, his rushing output exceeded that of Christian McCaffrey, although McCaffrey remained heavily involved in the offensive game plan.
Sam Darnold’s Efficient Night
Seattle quarterback Sam Darnold did not need to throw frequently because his team controlled the game on the ground and maintained a strong early lead. Darnold completed 12 of 17 passes for 124 yards, one touchdown, and no interceptions.
His most important contribution came early. Darnold connected with Jaxon Smith-Njigba for a four-yard touchdown in the first quarter, extending Seattle’s lead to 17–0. The drive demonstrated Seattle’s ability to take advantage of favorable field position after its explosive opening kickoff return.
Darnold’s numbers were not spectacular in volume, but they were efficient in context. He avoided turnovers and completed enough passes to keep the 49ers defense honest. With Kenneth Walker III producing on the ground, Seattle did not need to put the entire offensive burden on its quarterback.
Kenneth Walker III Was the Rushing Star
Among the most important pieces of the 49ers vs Seahawks match player stats was Kenneth Walker III’s rushing performance. Walker carried the ball 19 times for 116 yards and three touchdowns, averaging 6.1 yards per carry. His longest run covered 15 yards.
Walker scored once in the second quarter and twice in the second half. His final touchdown came early in the fourth quarter, giving Seattle a 41–6 advantage. The three-touchdown performance made him one of the game’s clearest statistical standouts.
His efficiency was just as important as the touchdown total. Walker consistently gained positive yardage and helped Seattle maintain control of the clock. His 116 rushing yards represented nearly half of Seattle’s offensive yardage, demonstrating how central the ground game was to the Seahawks’ approach.
Christian McCaffrey’s Production for San Francisco
Christian McCaffrey remains one of the most recognizable offensive weapons associated with the 49ers, but the Seahawks defense limited his impact in this matchup. McCaffrey rushed 11 times for 35 yards, averaging 3.2 yards per carry, with a longest run of eight yards.
He was more productive as a receiver than as a runner. McCaffrey caught five passes for 39 yards, giving him 74 yards from scrimmage. While that total shows that San Francisco continued to use him in multiple ways, it wasn’t enough to generate a sustained scoring threat.
Seattle’s ability to restrict McCaffrey’s rushing efficiency was significant. The 49ers rely heavily on creating space for their skill players, and when the ground game becomes difficult, the offense can become more dependent on passing execution. Seattle successfully disrupted that balance.
Jake Tonges Emerged as a Key Receiver
One of the more interesting receiving lines in the game belonged to Jake Tonges. The 49ers tight end caught five passes for 59 yards, leading San Francisco in receiving yardage.
Tonges averaged 11.8 yards per reception, which was a respectable figure given San Francisco’s overall offensive struggles. His involvement showed that the 49ers continued looking toward the middle of the field and their tight-end packages.
However, receiving production has to be considered within the larger offensive picture. Although Tonges led the team in receiving yards, San Francisco scored only six points. The Seahawks were able to prevent those individual completions from turning into touchdowns or sustained scoring drives.
Jaxon Smith-Njigba’s Touchdown Contribution
Jaxon Smith-Njigba caught three passes for 19 yards, but one of those receptions was particularly important. His four-yard touchdown catch from Darnold opened Seattle’s scoring and helped establish the tone of the game.
The relatively small receiving yardage total illustrates why raw yardage doesn’t always tell the entire story. Smith-Njigba’s biggest contribution was a scoring play that came during Seattle’s explosive first quarter.
Earlier in the 2025 season, Smith-Njigba had been a major part of Seattle’s passing offense. Entering the postseason, he had led the NFL in receiving yards during the regular season. His playoff matchup with San Francisco therefore received significant attention, even though Seattle ultimately won through a broader team effort.
Cooper Kupp’s Reliable Receiving Game
Cooper Kupp provided another useful receiving option for Seattle. He caught five passes for 60 yards, averaging 12 yards per reception. His longest reception went for 21 yards.
Kupp’s 60 receiving yards were the highest total among Seattle receivers in the game. His ability to move the chains complemented the rushing production from Walker and prevented San Francisco from focusing exclusively on stopping the run.
The distribution of Seattle’s passing numbers is worth noting. Darnold threw only 17 passes, yet Kupp still accumulated 60 yards. That is a good example of how a team can produce useful passing efficiency without relying on a high-volume aerial attack.
The Importance of Rashid Shaheed’s Kickoff Return
Special teams produced perhaps the most dramatic individual play of the opening minutes. Rashid Shaheed returned the opening kickoff 95 yards for a touchdown, immediately putting Seattle ahead 7–0.
That play had a huge effect on the game environment. Instead of beginning with a normal offensive possession, Seattle received an immediate six-point advantage before running a single offensive play. The Seahawks then added a field goal and touchdown to build a 17–0 first-quarter lead.
This is an important lesson when analyzing 49ers vs Seahawks match player stats: offensive box scores don’t capture every factor that determines a game. Special teams can change field position and scoreboard pressure before an offense even has an opportunity to establish itself.
Seattle’s Rushing Attack Controlled the Game
Seattle’s overall rushing performance was one of the biggest statistical differences between the teams. The Seahawks recorded 173 rushing yards on 33 attempts, while San Francisco finished with 108 rushing yards on 27 attempts.
Walker accounted for 116 of Seattle’s rushing yards by himself. Rashid Shaheed added 27 yards on two carries, while Zach Charbonnet contributed 20 yards on five carries. That gave Seattle several effective rushing options rather than relying on only one player.
San Francisco’s rushing attack was more fragmented. Purdy led the team with 37 rushing yards, McCaffrey had 35, and Jordan James added 28. The combined numbers were respectable, but Seattle’s ability to turn rushing opportunities into touchdowns made the difference.
San Francisco’s Offensive Line and Pressure Problems
The passing statistics also point toward a difficult night for San Francisco’s offense. Purdy completed just 15 of 27 attempts and was sacked twice for 16 yards. The Seahawks defense also forced an interception and contributed to the 49ers’ three-turnover total.
When an offense is operating from behind, the pressure becomes even more challenging. San Francisco had to find ways to generate larger chunks of yardage, but Seattle’s defense limited the opportunities for explosive plays.
The 49ers also attempted to use Mac Jones during the game. Jones completed two of four passes for four yards. That additional quarterback usage came during a game in which San Francisco was already struggling to produce offensive momentum.
Seattle’s Defense Created Extra Possessions
Turnovers were arguably the clearest defensive statistic in the game. Seattle finished with zero turnovers, while San Francisco committed three. The 49ers lost two fumbles in addition to throwing one interception.
Extra possessions are especially valuable when an offense is efficient. Seattle did not need to run an enormous number of plays because its defense and special teams repeatedly put the team in favorable situations.
San Francisco ran 60 offensive plays compared with Seattle’s 52, yet the 49ers scored only six points. That contrast demonstrates why play volume by itself is not a reliable measure of offensive success. Seattle generated more yardage per play and converted its opportunities more effectively.
A Look at the Team Statistical Comparison
The team numbers provide useful context for the individual 49ers vs Seahawks match player stats.
| Category | 49ers | Seahawks |
|---|---|---|
| Final Score | 6 | 41 |
| Total Yards | 236 | 281 |
| Yards Per Play | 3.9 | 5.4 |
| Offensive Plays | 60 | 52 |
| Rushing Attempts | 27 | 33 |
| Turnovers | 3 | 0 |
| Time of Possession | 28:49 | 31:11 |
| Penalties | 3 | 2 |
| Penalty Yards | 36 | 5 |
Seattle’s statistical efficiency stands out. The Seahawks ran fewer plays but gained more total yards and averaged significantly more yards per play. They also avoided turnovers and committed fewer penalties.
San Francisco actually possessed the ball for a respectable amount of time and ran more plays, but those possessions didn’t produce enough points. This is why examining only possession or play count can be misleading.
First Quarter Stats Changed the Game
The first quarter deserves special attention because it created the environment for everything that followed. Seattle scored 17 points before San Francisco found the scoreboard.
Shaheed’s 95-yard kickoff return began the scoring. Jason Myers then kicked a 31-yard field goal before Darnold found Smith-Njigba for a touchdown. The rapid sequence gave Seattle a three-score advantage.
San Francisco was forced to play from behind almost immediately. Against a defense capable of creating turnovers, that is a difficult position. The 49ers eventually scored two field goals in the second quarter, but they could not turn those opportunities into touchdowns.
Second-Half Rushing Dominance
Seattle continued its physical approach after halftime. Myers added a 24-yard field goal in the third quarter, while Walker scored twice in the second half.
The second-half touchdowns demonstrated that Seattle wasn’t simply protecting its lead through conservative offense. Walker continued gaining significant yardage and eventually reached 116 rushing yards.
San Francisco, meanwhile, failed to score in either the third or fourth quarter. Once Seattle had established a large advantage, the 49ers could not generate the offensive response needed to make the game competitive.
Why Efficiency Matters More Than Raw Volume
One of the biggest takeaways from these 49ers vs Seahawks match player stats is the difference between volume and efficiency. San Francisco ran 60 plays, eight more than Seattle, but generated only 236 yards. Seattle produced 281 yards on 52 plays.
That works out to 3.9 yards per play for San Francisco compared with 5.4 for Seattle. Over dozens of plays, even a relatively small efficiency gap can become substantial.
The same principle applies to quarterback statistics. Darnold threw fewer passes than Purdy, but he produced a touchdown without an interception. Purdy attempted more passes but finished without a touchdown and threw one interception.
How the Earlier Regular-Season Meetings Add Context
The playoff game cannot be fully understood without considering the earlier meetings between these NFC West rivals. In Week 1, San Francisco won 17–13 in Seattle. In Week 18, Seattle won 13–3 in Santa Clara.
The Week 18 meeting was particularly defensive. Seattle finished with 361 total yards while San Francisco managed only 173. Darnold completed 20 of 26 passes for 198 yards, while Purdy completed 19 of 27 for 127 yards and threw an interception.
Those regular-season statistics provided clues about how the playoff matchup might develop. Seattle’s defense had already demonstrated an ability to restrict San Francisco’s offense, and the Seahawks repeated that success on the postseason stage.
Christian McCaffrey Versus Kenneth Walker
Comparing the two primary running backs provides an easy way to understand the difference in offensive production.
McCaffrey finished with 35 rushing yards on 11 attempts and 39 receiving yards on five receptions. Walker, on the other hand, rushed for 116 yards on 19 attempts and scored three touchdowns while also catching three passes for 29 yards.
The contrast doesn’t mean the two players had identical workloads or responsibilities. San Francisco’s offense used McCaffrey in multiple roles, while Seattle leaned heavily into Walker’s rushing ability once the game developed in its favor.
Still, the numbers show how effectively Seattle converted its running opportunities into points. Walker’s three rushing touchdowns were a defining feature of the game.
The Role of Field Position
Field position is another part of the statistical story that shouldn’t be ignored. Seattle’s opening kickoff return immediately placed the Seahawks in a strong scoring position and produced a touchdown without requiring an offensive snap.
That kind of play can alter play calling. Once a team builds a large lead, it can lean more heavily on the running game, force the opponent to throw, and create opportunities for the defense to attack predictable situations.
San Francisco never found the type of field-position advantage it needed to produce a comeback. Its six points came entirely from field goals, meaning the 49ers failed to finish drives with touchdowns.
What the Receiving Numbers Tell Us
Seattle’s receiving statistics were balanced rather than volume-heavy. Kupp led the team with 60 yards, while Walker added 29 receiving yards and Smith-Njigba recorded the touchdown reception.
San Francisco had Tonges at 59 receiving yards, McCaffrey at 39, and Jennings at 23. No 49ers receiver recorded a touchdown.
That last point is particularly important. San Francisco’s offense moved the ball enough to produce individual receiving numbers, but those completions rarely translated into points. Seattle’s ability to finish drives created the biggest difference.
What the Turnover Numbers Reveal
The turnover margin was one of the clearest statistical indicators of Seattle’s control. The Seahawks finished with zero turnovers, while San Francisco committed three.
Two lost fumbles meant that Seattle received extra possessions without needing to win every individual offensive drive. The 49ers’ interception added another negative play.
In playoff football, protecting the ball becomes especially important. A team can survive an occasional stalled drive, but repeated turnovers against an efficient opponent can produce a rapidly widening scoreboard.
The Importance of Penalties
Penalties were not the primary reason for the outcome, but they also favored Seattle. The Seahawks committed two penalties for five yards, while San Francisco had three penalties for 36 yards.
The raw difference isn’t enormous in penalty count, but penalty yardage can influence field position and drive efficiency. Seattle’s five penalty yards were particularly low.
Combined with the turnover advantage, the low penalty total helped the Seahawks maintain cleaner possessions and avoid giving San Francisco unnecessary opportunities.
What the 49ers Can Take From the Numbers
From San Francisco’s perspective, the statistics highlight several areas that needed improvement. The offense produced only 236 yards and averaged 3.9 yards per play, while turnovers repeatedly ended possessions.
The 49ers also failed to score a touchdown. McCaffrey was limited to 35 rushing yards, and Purdy did not throw a touchdown pass.
At the same time, there were individual positives. Purdy rushed for 37 yards, Tonges caught five passes for 59 yards, and McCaffrey contributed 74 yards from scrimmage. The issue was turning those individual contributions into sustained scoring drives.
What the Seahawks Numbers Show
Seattle’s statistical profile was built around efficiency, ball security, and rushing production. Walker’s 116 yards and three touchdowns were the headline offensive numbers, while Darnold’s 12-of-17 passing line showed efficient quarterback play.
The defense did its part by forcing three turnovers and limiting San Francisco’s scoring opportunities. The special teams unit added a spectacular opening kickoff return for a touchdown.
Perhaps most importantly, Seattle’s numbers were complementary. The offense didn’t need to throw 40 times because the running game was productive. The defense didn’t need to dominate possession because it created turnovers. Special teams created an early seven-point advantage.
Why the Matchup Was So Statistically Interesting
The 49ers vs Seahawks match player stats demonstrate how multiple phases of football can combine to produce a decisive result. Seattle’s quarterback did not throw for a huge number of yards, but he avoided interceptions. Its running back produced more than 100 rushing yards and three touchdowns. Its receiver scored an early touchdown. Its returner opened the game with a 95-yard score.
San Francisco had productive players, too. Purdy rushed for 37 yards, Tonges caught five passes for 59 yards, and McCaffrey contributed both rushing and receiving yardage. But the team couldn’t translate those numbers into touchdowns.
The game therefore serves as a useful reminder that individual statistics should always be viewed within their team context. A 59-yard receiving performance can be valuable, but its impact is different when the offense scores only six points.
Key Player Stats at a Glance
For readers looking specifically for the most important 49ers vs Seahawks match player stats, these were among the standout numbers:
| Player | Team | Key Stats |
|---|---|---|
| Brock Purdy | 49ers | 15/27, 140 passing yards, 1 INT; 37 rushing yards |
| Christian McCaffrey | 49ers | 35 rushing yards, 39 receiving yards |
| Jake Tonges | 49ers | 5 receptions, 59 yards |
| Jauan Jennings | 49ers | 2 receptions, 23 yards |
| Sam Darnold | Seahawks | 12/17, 124 yards, 1 TD |
| Kenneth Walker III | Seahawks | 19 carries, 116 yards, 3 TDs |
| Cooper Kupp | Seahawks | 5 receptions, 60 yards |
| Jaxon Smith-Njigba | Seahawks | 3 receptions, 19 yards, 1 TD |
| Rashid Shaheed | Seahawks | 95-yard kickoff return TD |
These numbers provide a quick snapshot, but the complete box score gives a fuller picture of how the game unfolded.
Final Takeaway on the 49ers vs Seahawks Match Player Stats
The 49ers vs Seahawks match player stats from the January 17, 2026 NFC Divisional Round tell a remarkably clear statistical story. Seattle won 41–6, generated 281 total yards, averaged 5.4 yards per play, rushed for 173 yards, and committed no turnovers. San Francisco produced 236 total yards, averaged 3.9 yards per play, and turned the ball over three times.
Kenneth Walker III was the biggest individual offensive statistical standout, rushing for 116 yards and three touchdowns. Sam Darnold provided efficient quarterback play, Cooper Kupp led Seattle in receiving yards, and Rashid Shaheed delivered the spectacular 95-yard kickoff return touchdown.
For San Francisco, Brock Purdy led the passing game while also contributing 37 rushing yards. Christian McCaffrey remained involved as both a runner and receiver, and Jake Tonges led the 49ers in receiving yardage.
Ultimately, the box score shows that Seattle’s victory came from more than one player. The Seahawks combined special teams explosiveness, rushing efficiency, clean quarterback play, ball security, and defensive takeaways. That’s why the final score was so much more decisive than the modest total-yardage difference might initially suggest.
Stats above refer specifically to the January 17, 2026 NFC Divisional Round matchup at Lumen Field, rather than a future 2026 regular-season meeting. The teams are scheduled to meet again in Seattle in Week 5 of the 2026 regular season on October 11, 2026.
you also may read